
What a Claude plan actually buys, in API dollars
Anthropic quotes its plans as multiples of Pro, never as tokens. Measured against a production agent pipeline closing about 900 tickets a week: a Team Standard 5-hour window holds about $24 of Opus at API list price, a Max 20x window about $382. The 5-hour multiples are as advertised. The weekly ones aren't, and the week is the limit you hit. Plus what a ticket costs, and the review loop that was eating a fifth of the spend.
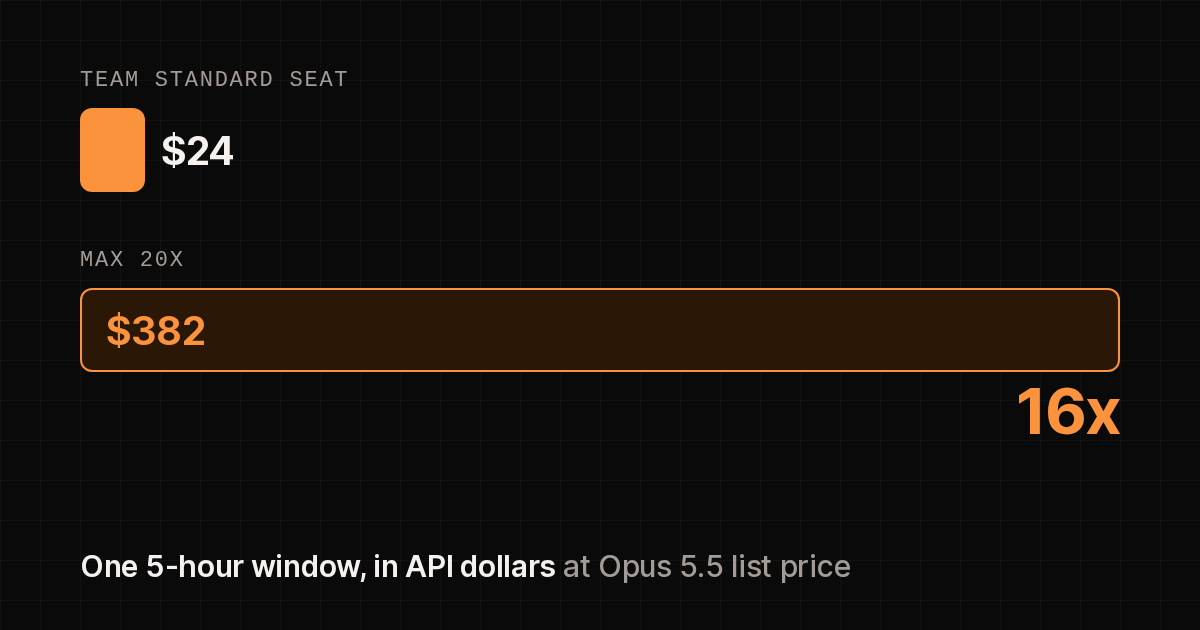
Anthropic sells Claude plans as multiples of Pro - Max 20x is "20x more usage than Pro", a Team Premium seat is "5x more usage than standard seats" - and never says what Pro is. So choosing between another seat and a bigger plan means comparing multiples of an unknown.
We run several Claude logins on one workstation, all driving Claude Code agents, so I measured it. Every token in the transcripts priced at Opus 5.5's API list price, set against each login's usage meter, October 2026:
| plan | one 5-hour window | one week | windows per week |
|---|---|---|---|
| Pro (implied) | ~$19 | - | - |
| Team Standard | $24 (90% CI $23.6-24.4) | $236 | 9.8 |
| Team Premium | $112 (90% CI $110-116) | ~$1,096 | ~9.8 |
| Max 5x | $96 | $1,113 | 11.6 |
| Max 20x | $382 (90% CI $356-410) | $2,322 | 6.1 |
What's doing the spending
The numbers only mean something if you know the workload, and this one isn't someone chatting to a model and pasting the answer into an editor. It's a software estate of about 200 repositories - shared libraries, client applications, internal services - with 10,271 commits between 1 August and 14 October, worked by agents under the controls you'd expect of a team in a regulated business:
- Every change starts as a ticket, with a type, a priority, a size and a risk rating: Low, Medium or High. The risk sets how hard the change is reviewed.
- Each ticket runs in its own isolated fork of the workspace and its development data, so agents working in parallel never touch each other's work.
- Decisions go to a person. Before building, the agent lists the design decisions the ticket leaves open, and if any of them would change what gets built, it hands the ticket back with the question. New features are planned with a person and split before an agent sees them.
- Nothing is committed untested or unreviewed. The agent has to show a test that fails without its change, then pass a code review sized to the ticket's risk. A commit guard refuses the commit until the review has run. Tests run in up to four tiers - unit, real database, protocol (API and MCP) and browser - and CI runs them on every push.
- Nothing reaches production without a person. Agents commit and push. They never cut a release or deploy one. A release refuses a commit whose CI isn't green, and a person cuts and deploys it. Deployment is config-as-code, so a rollback is a redeploy of the previous image.
- It's all on the record. Ticket, commits, CI builds, changelog entry and release link to each other, and the agent's close-out on the ticket says what it changed, what it tested and what it left for someone else.
Throughput went from about 290 tickets done a week in September to 907 in the week of 5 October. Over the same period, tickets reopened after closing stayed flat at 1-1.5%.
The 5-hour window is as advertised
Every 5-hour figure lands where Anthropic's multiples say it should. A Standard seat is 1.25x Pro, Max 20x is 20x, and $382 / $24 is 16 - which is 20 / 1.25. Max 20x is 3.98x Max 5x, against an advertised 4x. Premium is 4.7x Standard, against 5x. Work backwards from any of them and Pro's window is about $19.
The week isn't
The weekly limits don't scale with the windows:
- Max 20x holds 2.09x Max 5x per week, for twice the price. Claude.ai's checkout badges 20x as "Save 50%" - true of the 5-hour window, not of the week.
- Max 20x holds about 10x Team Standard per week, against 16x per window.
- A Max 20x week is only 6.1 full windows. Team and Max 5x weeks are nearer 10-12.
So a login running agents around the clock hits the weekly cap long before the 5-hour one bites, and then there's nothing to do but wait for the reset date. If you're sizing for agents, the week is the number that matters.
Per pound
As charged on a UK checkout, including VAT, for anyone who can't reclaim it:
| plan | per month inc VAT | list-price $ per week | list $ per £ |
|---|---|---|---|
| Max 20x | £180 | $2,322 | 12.9 |
| Max 5x | £90 | $1,113 | 12.4 |
| Team Standard | £22.50 | $236 | 10.5 |
| Team Premium | £113 | ~$1,096 | 9.7 |
Max 5x and Max 20x cost the same per token, within about 4%, which is inside the error. Two Max 5x accounts hold about the same week as one Max 20x for the same money. The 20x still wins: one login, and a window four times the size. That matters when a batch of agents starts at once - a fresh Max 5x account running nothing but tickets burned through its second 5-hour window in about fifteen minutes, with forty-odd runs still queued. Team seats are the dearest capacity measured here: a quarter to a third less per pound than Max.
Sonnet isn't half price on the meter
Sonnet's API list price is half Opus's. On the meter it isn't: a Sonnet list-price dollar used 1.27x an Opus dollar's allowance on one Premium seat (range 1.16-1.37) and 1.31x on another (1.17-1.46). So a Sonnet token costs about 0.65 of an Opus token against your plan, not 0.5. Still cheaper, by less than the price list suggests.
Upgrading mid-week resets the meter
Upgrading a login from Max 5x to Max 20x part-way through a week reset both
meters to 0%, the 5-hour and the weekly, and the weekly reset date didn't
move. What was used of the 5x week was written off and the whole 20x week was
there at once. So if you're going to upgrade, do it early in a well-used week,
not the day before it resets. (The stored token went on saying max_5x until
the next /login. The limits changed server-side straight away.)
What a ticket costs
Each agent run works one ticket, so the transcripts give a cost per ticket, subagents included. From 6 to 14 October the pipeline made 1,171 runs at 806 distinct tickets and closed 629 of them, for $4,452 at list price: $7.08 per closed ticket, all in, counting the runs that bounced back for a decision or never finished.
Per closed run, the shape is a long tail:
| median | notes | |
|---|---|---|
| all closed runs | $2.53 | p90 $12.79, max $137 |
| Low risk | $0.95 | |
| Medium risk | $2.85 | |
| High risk | $7.21 | 127 runs |
| Task | $1.37 | |
| Bug | $2.38 | |
| Improvement | $2.44 | |
| New Feature | $9.99 | 71 runs |
The dearest 10% of runs took 49% of the spend. The $137 one was a whole video subsystem in one ticket, which is why new features now get planned and split first. So the median ticket is about a tenth of a Team Standard window, and one ticket can take more than five windows. Scheduling by ticket count doesn't work. Scheduling by the meter does.
Sonnet on small tickets ran at a median $0.32 list, or $0.51 of Opus-equivalent allowance once the meter's weighting is applied, against $0.94 for Opus: about 2-2.7x cheaper. A blind review of 43 commits found 0.41 real defects per commit from Sonnet and 0.25 from Opus, with Sonnet's gaps on the larger tickets (follow-ups in other repositories not filed, thin tests). So Sonnet gets small, low-risk tickets only.
The review loop
The biggest single cost driver was the review policy.
High-risk tickets were told to re-review "until it comes back clean". The high-level review returned about 8 findings on almost every pass, and only 38 of 1,444 passes ever came back clean. So loops ran to 15, 20, once 47 passes. Reading the eight longest pass by pass, a late loop mostly reviews its own fixes: 7-14 contradictions per run, where a later pass asks for the reverse of an earlier one, 26-47% of findings repeating earlier ones, and in one case late fixes that broke what earlier passes had got right. A blind grading of 615 findings put the point where they stopped being worth blocking a merge on at typically pass 4-8.
Passes beyond the policy cost about $880 in those nine days, a fifth of the one-shot spend. The fix was a bounded loop: at most two high passes, the second covering only the fixes, with the first pass's findings and what was decided about each. Medium-risk reviews went from 2.02 passes to 1.00, and their share of run cost from the first review onwards from 52% to 35%. A contradiction between passes is now a design question for a person, not another fix.
There's a fuller post in this - what the reviewer finds at each pass, and how to give a review loop an exit - which I'll write up separately.
How it was measured
Two sources, joined on time.
The meter. Claude Code's /usage reads an endpoint that returns, per
login, the percentage used in the 5-hour and 7-day windows and when each
resets. A timer polls it every 5 minutes per login and writes the readings to
VictoriaMetrics:
curl -s https://api.anthropic.com/api/oauth/usage \
  -H "Authorization: Bearer $TOKEN" -H "anthropic-beta: oauth-2025-04-20"
It rate-limits, so a reading is sometimes a cached one up to 30 minutes old. The poller records each reading's age, and the analysis backdates every reading by it.
The tokens. Every Claude Code transcript (~/.claude/projects/**/*.jsonl,
subagents included) carries a usage block on each assistant message: input,
cache reads, 5-minute and 1-hour cache writes, output. Two traps:
- A message is written once per content block, each repeating the usage,
with
output_tokensgrowing as it streams. Dedupe onmessage.id: count input and cache once, and output at its maximum. Summing lines overcounts badly. - Working out which login a session belongs to. Separate logins are
separate
CLAUDE_CONFIG_DIRs, but they can share oneprojects/directory (ours do), so the transcript path doesn't tell you.history.jsonlonly records typed prompts, which misses every headless session (claude -p, remote control) and its subagents - 69% of our tokens. What works is each config dir'ssession-env/, which holds a directory per session that ran under it. The logins' sets never overlap.
Each message is priced at list (Opus 5.5: $4 input, $0.20 cache read, $5 5-minute write, $8 1-hour write, $20 output per million tokens). For every pair of meter readings at least 20 minutes apart in the same window, the percentage moved is fitted against the dollars spent between them, through the origin. Windows that hit 100% are dropped, because a capped window stops measuring. The confidence intervals resample whole windows, not readings.
Max 20x and Team Standard come from 6-10 October (216 intervals over 20 windows for Max 20x, 151 over 20 for two Standard seats), Team Premium from 14 October, and Max 5x from a fresh account on 16-17 October that ran nothing but agent tickets, so the transcripts saw every token its meter counted. The ticket figures join 233,899 deduplicated API calls to the full state history of 6,342 tickets and every commit.
The meter follows list price
Fitting the same data with different weightings:
| weighting | Max 20x R² | Team seat 1 R² | Team seat 2 R² |
|---|---|---|---|
| API list price per token type | 0.952 | 0.996 | 0.999 |
| raw token count | 0.890 | 0.975 | 0.982 |
| output tokens only | 0.867 | 0.990 | 0.997 |
List price wins, and on the Team seats it's close to exact. But every weighting fits reasonably, because an agent's token mix barely changes from one 20 minutes to the next, so the fit can't pin individual weights. Halving or doubling the cache-read price moves R² by under 0.01 on the Team seats and under 0.03 on Max 20x. "The meter is roughly API cost" is supported. "The meter is exactly API cost" isn't.
Where the cost goes
| share of tokens | share of cost | |
|---|---|---|
| cache reads | 97.5% | 49% |
| cache writes (5m + 1h) | 2.1% | 32% |
| output | 0.4% | 19% |
| uncached input | ~0% | ~0% |
So anything that counts raw tokens ("10 billion tokens this week") is mostly counting cache reads, at a twentieth of the input price. Cache writes are the quiet cost: 2% of tokens, a third of the bill. Every context that gets rebuilt - a new subagent, a compaction, a session resumed after the cache expired - pays that again. A run parked at a 5-hour limit and resumed later had a median cost of $10.70, against $2.06 for one that ran straight through (long runs park more, so some of that is selection).
Limits
- A few days per plan, one account per plan. The weekly figures rest on one or two weeks each, and Max 5x's is fitted from the first 17% of a week.
- Usage the transcripts can't see. The meter counts everything on the account - claude.ai chat, the mobile app, Claude Code on another machine. On 6 October the Max 20x meter moved 46 points in 25 minutes with $16 in the transcripts, so that window came out of the fit. Anything smaller hides in the noise, and it's why the Max 20x fit is looser than the Team ones.
- The meter reads whole percentages. On a Team Standard seat 1% is about $0.24, so short intervals quantise badly. That's why the intervals are at least 20 minutes long.
- The weekly meter moves in steps. It sat at 9% for four hours on the Max 5x account and jumped to 17% within ten minutes of a 5-hour reset. The totals still track spend (9% at $96, 17% at $191), but don't read a weekly percentage as live.
- Heavy caching reads high. wokey.ai's measurement across 36 accounts (5-12 October) puts a Max 20x week at about $1,751. Ours is higher, which fits a workload that's 97.5% cache reads.
- Transcripts expire. Claude Code deletes them after 30 days, so nothing here reaches back past mid-September.
- None of this is a contract. Anthropic can change any of it, and the multiples on the pricing page are all it commits to.
If you've measured Pro directly, I'd love to compare - it's the one row here that's inferred rather than measured.